A fast, responsive development process is important. You don’t want to be waiting around for 45 seconds for your Rails app to rebuild every time you make a change. But that’s exactly the situation I found myself in this week. I went down a bit of a rabbit hole diagnosing the problem and dug up some useful Rails profiling tools in the process.
Rack Mini Profiler
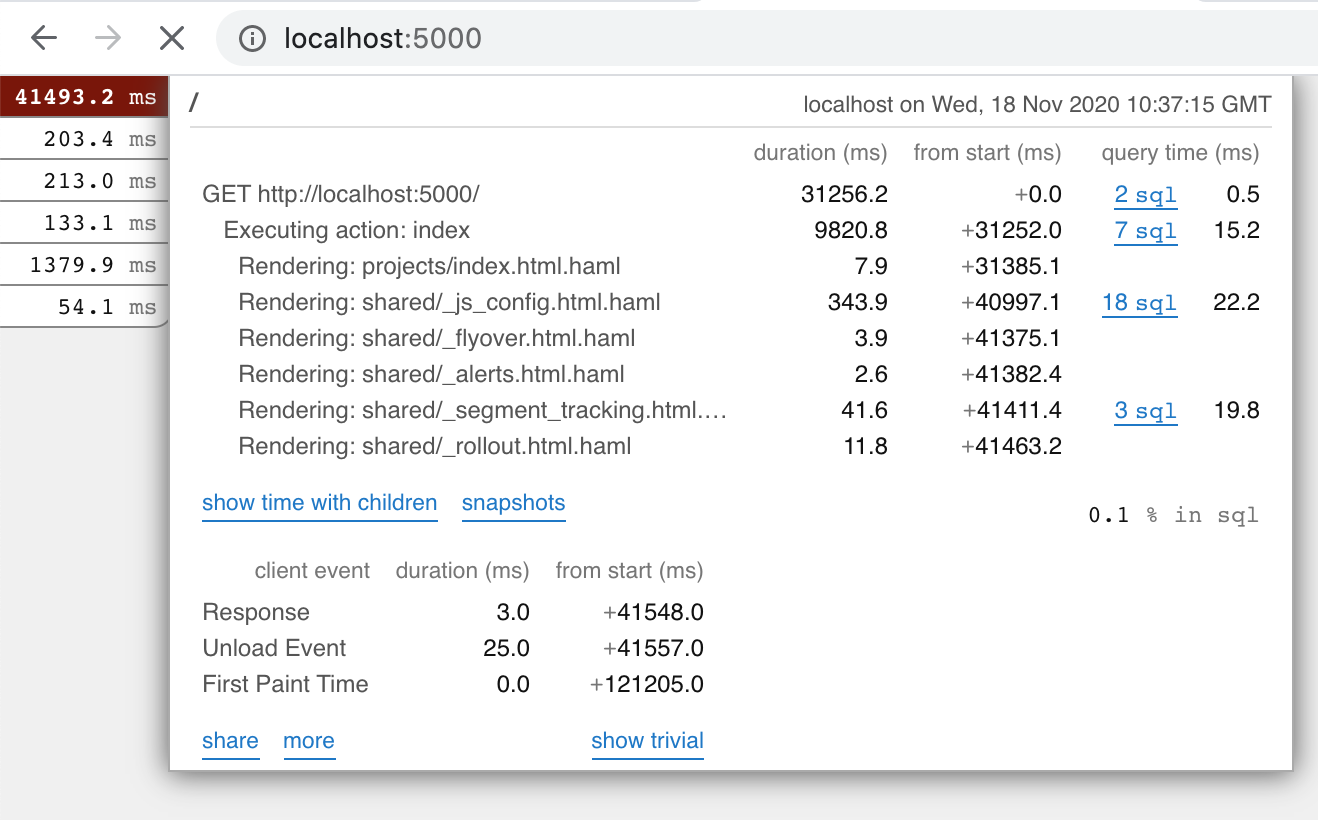
rack-mini-profiler is the go-to Rails profiling gem and with good reason. It gives you a little widget in the corner of your app which shows you how long the page took to render, and where that time was spent. Here’s a screengrab from the aforementioned ~45 second load time page:

The flamegraph gem is often used with rack-mini-profiler. While flamegraphs didn’t help me in this instance, this fantastic article from Justin Weiss details how to use them.
DevTrace
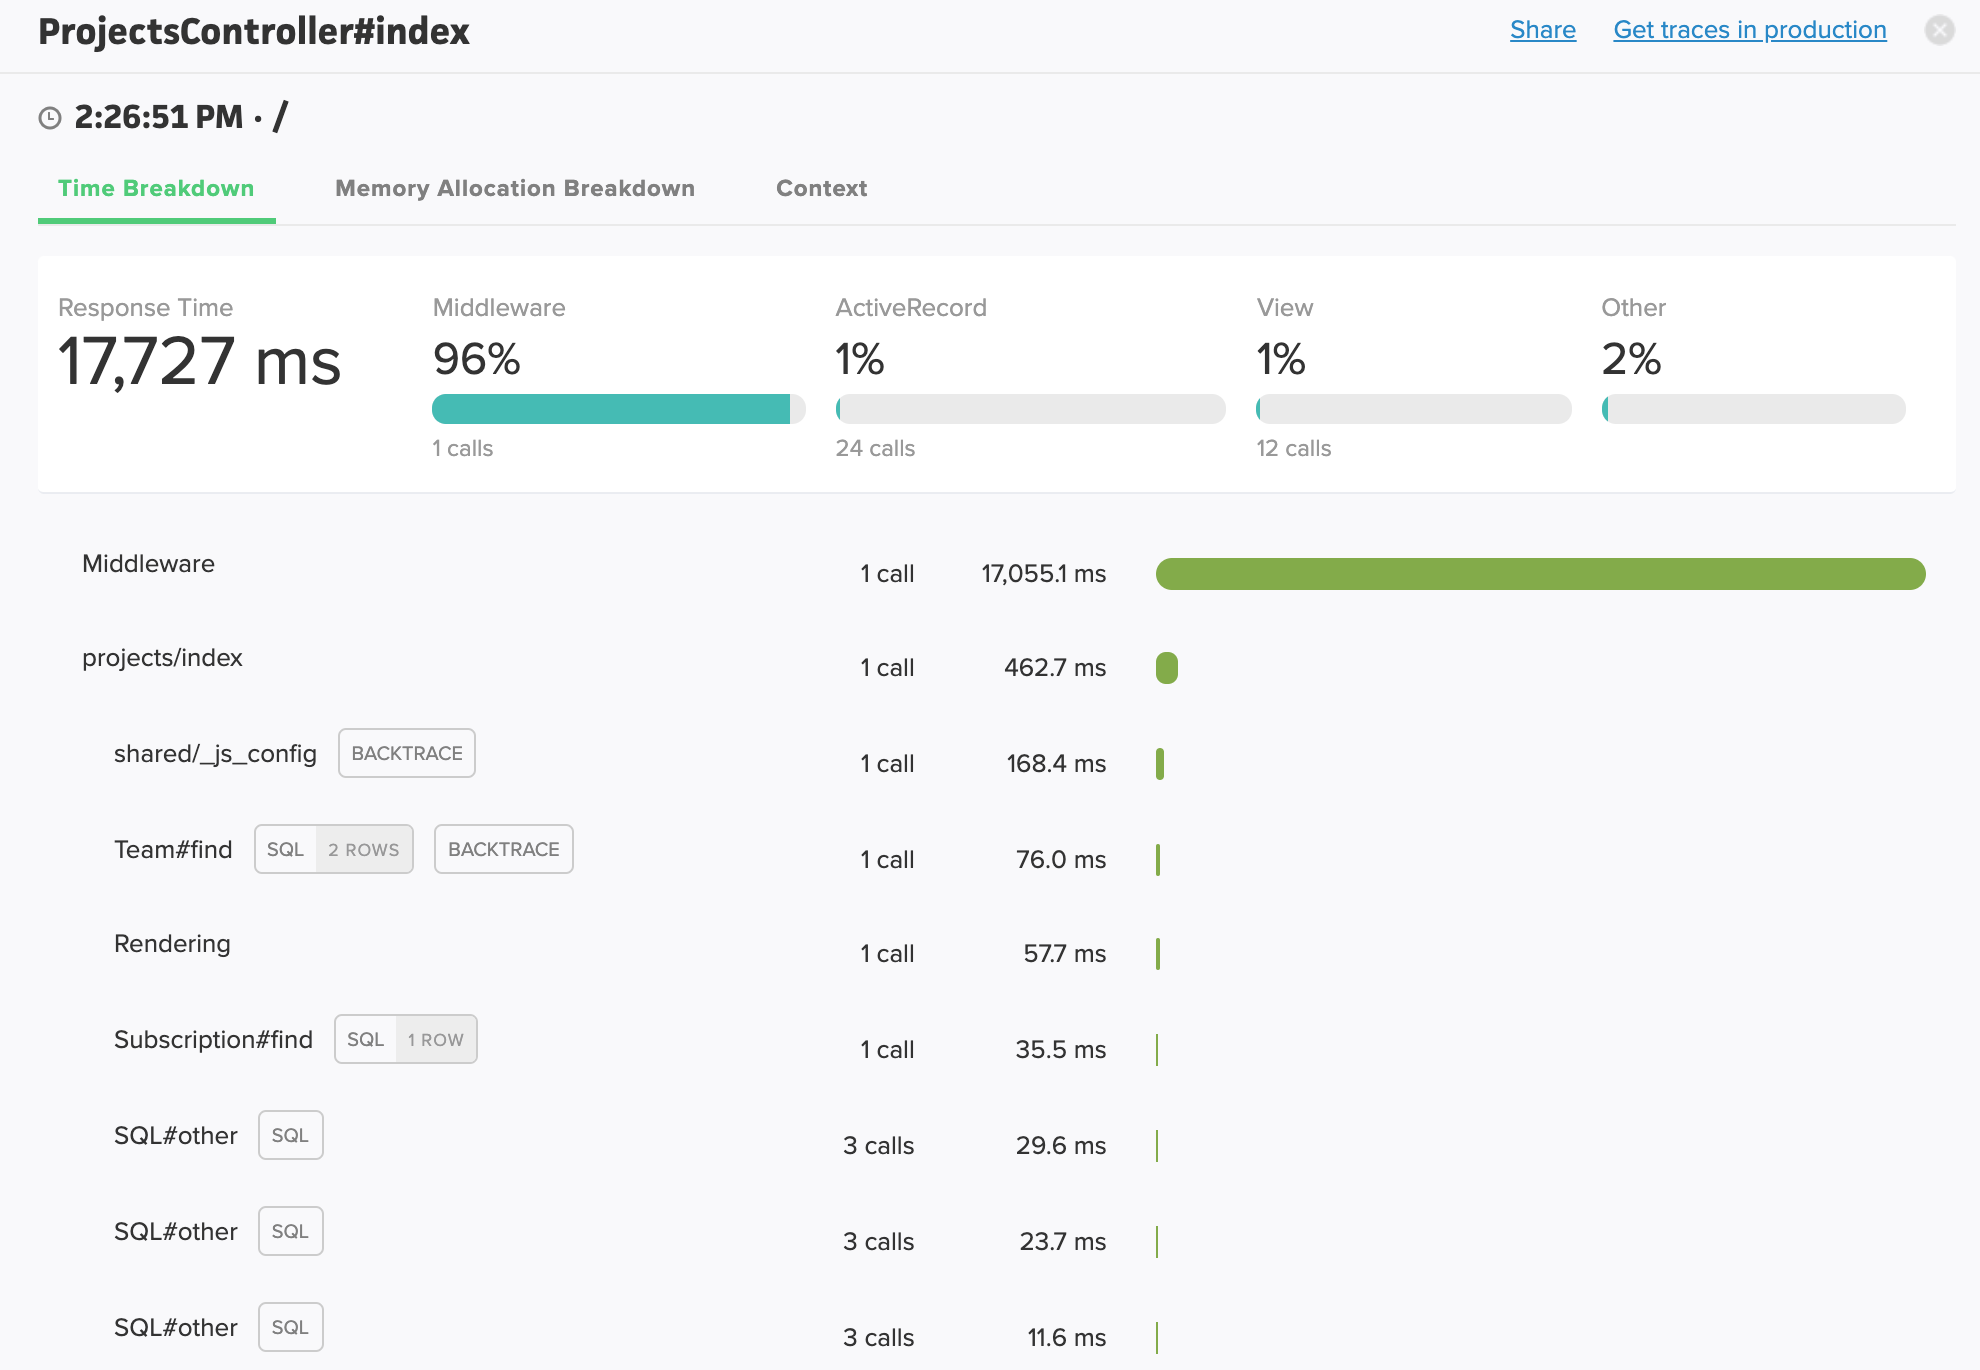
Scout’s DevTrace offers much of the same information as Rack Mini Profiler, but with a slicker interface, and more contextual detail. In my case I was able to see that the app was spending a lot of time in Middleware - something Rack Mini Profiler didn’t highlight.

Chrome Rails Panel
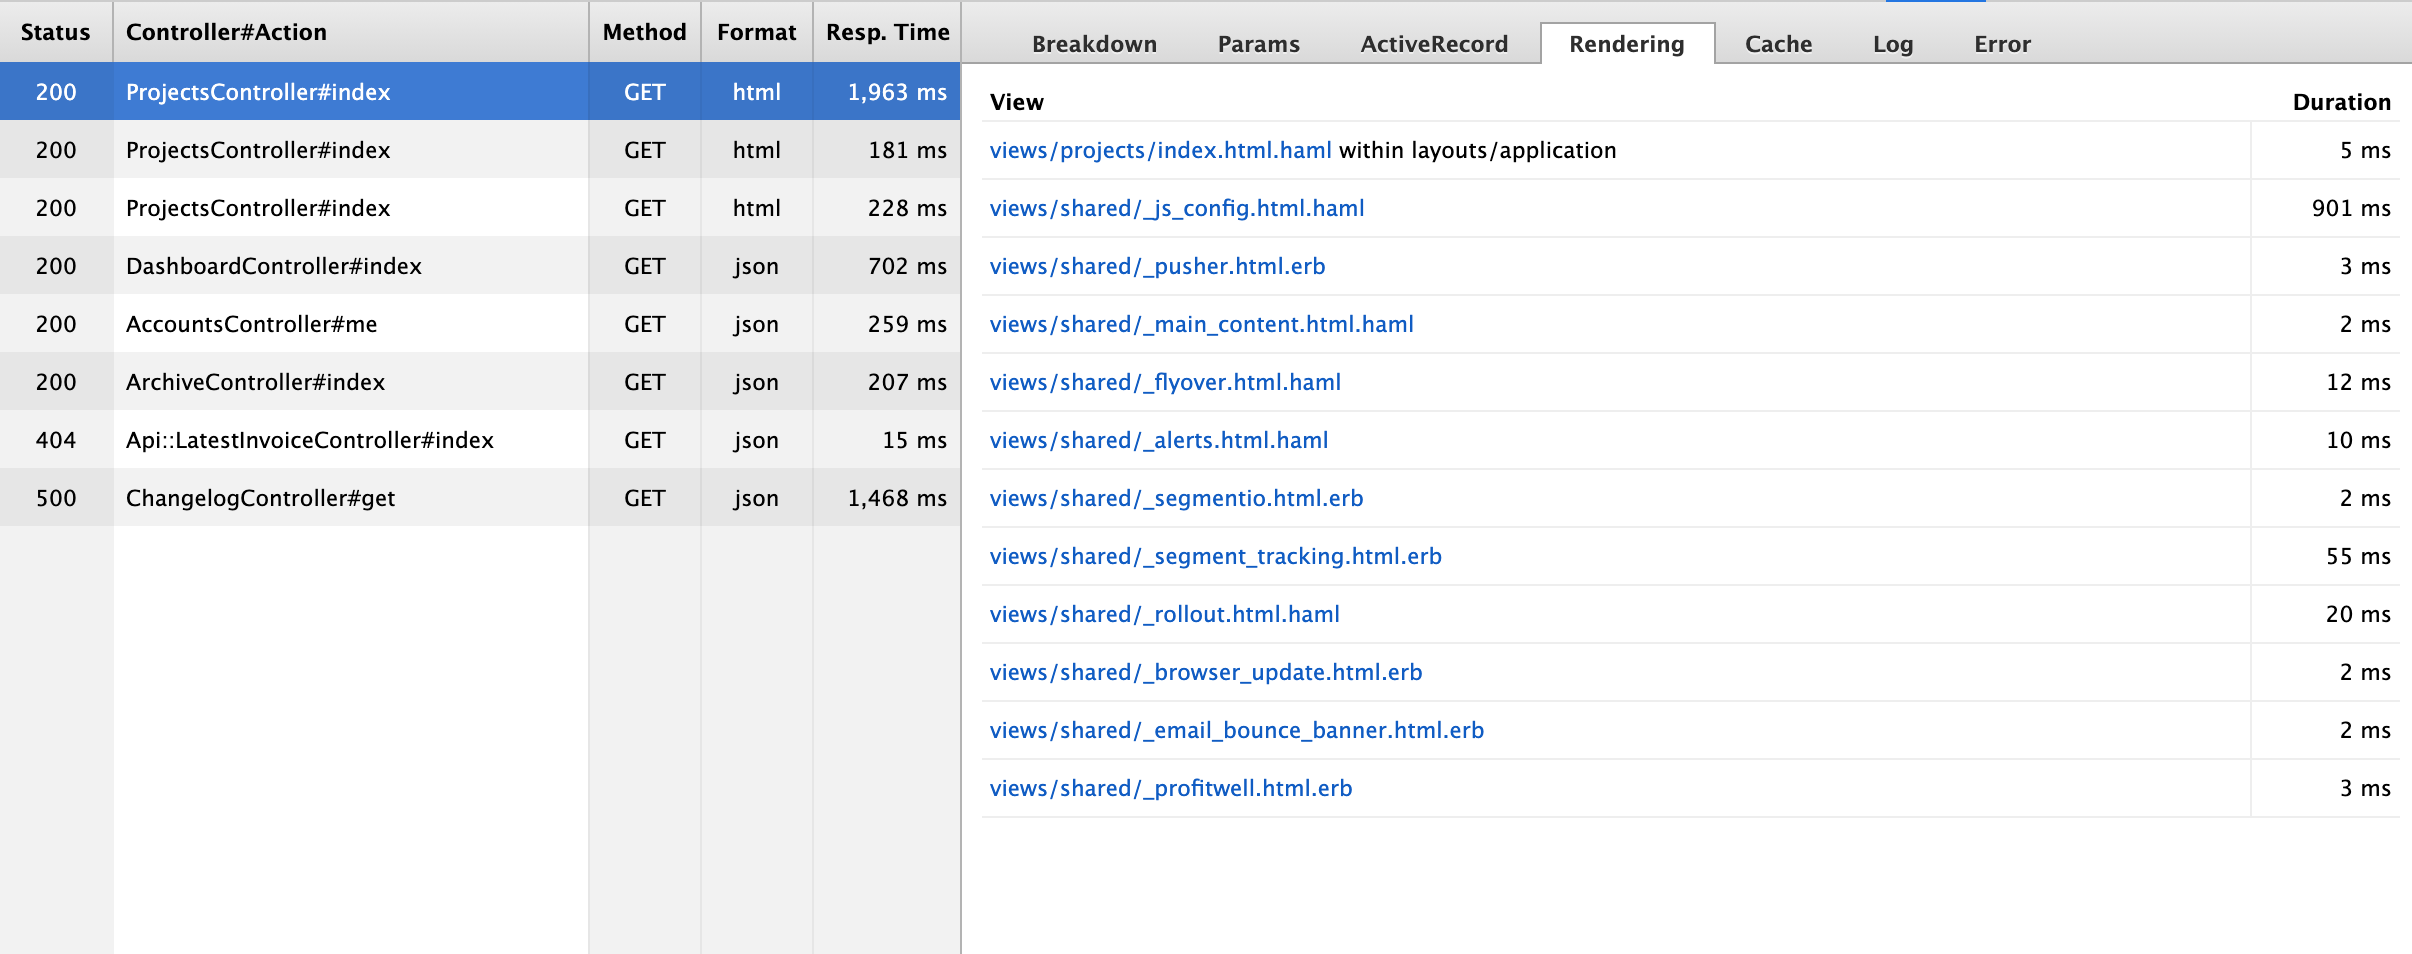
Chrome Rails Panel is a Chrome Extension which shows you app profiling information in Chrome Dev tools. While it still requires an additional gem (meta_request), it doesn’t add a button to your UI like DevTrace or Rack Mini Profiler. A good option if you want to keep your UI clean.

Test response time with CURL
Profiling aside, I found myself refreshing my browser repeatedly while debugging my slow dev environment. This got old, fast. Thankfully, there’s a better way - use curl from the command line:
$ curl 'http://localhost:5000' -s -o /dev/null -w "%{time_starttransfer}\n"This makes a web request to localhost:5000 and spits out the response time. Easy peasy.